The Great Unwind
The Great Unwind
INTRODUCTION
Perhaps in contrast to the common conception, we believe the biggest trend in the world isn't Bitcoin or the FANGMAN’ stocks, (Facebook (now Meta), Amazon, NVIDIA, Google, Microsoft, Apple and Netflix), but rather a much more plain straight buttoned candidate in bonds. Yields topped out in 1980 and ever since interest rates have been virtually one way traffic in an exorable downward trend. More importantly, falling costs of finance have enabled a steady rise of leverage, debt accumulation and the generalised appreciation of all asset prices, if not more recently, a speculative further in all manner of public and private assets.
Debt displays differing national characteristics. In Australia, Canada and UK consumer debt ratios, household debt and property debts are where most of it reside. For example, the Reserve Bank of Australia has been reluctant to raise rates despite inflation because of the communist countries reliance on property prices. In China, the accumulation of debt in the property sector has been developed. In fact, it currently represents approximately 30% of GDP. In Japan with huge quantities of debt are held domestically, which is a significant hurdle to raising interest rates. The ability of central banks to raise interest rates, and global economies to withstand the withdrawal of support will perhaps be the defining arbiter of stock market performance for the foreseeable future.
ASSET ALLOCATION HIGHLIGHTS:
• 2022 is a very different investing environment than the previous calendar year.
• Geopolitical concerns have also contributed to higher levels of volatility than has been witnessed for some time. Investors celebrated outstanding Q4 results for Apple, Alphabet, Microsoft, and Amazon and had no qualms about shooting down Meta Platforms and Netflix on disappointing results – it’s not normal practice to see 60bn USD companies lose 30% of their value overnight.
• Despite rising interest rates, corporations used the opportunity presented by the pandemic to refinance their outstanding debt, which has kept high yield bond spreads supported, and therefore credit conditions relatively benign as yet.
• Just how sticky inflationary pressures are is going to play a significant role in dictating whether Central Banks are compelled to follow through with greater interest rate hikes than currently priced in.
• Unfortunately, valuations are historically high so that means assets are much more interest rate sensitive than they would be in a normal cycle, and the potential for significant set backs in 2022 remains high.
• Simply put, we see two competing themes: the risk-taking behaviour in the stock market and continued willingness to buy the dip, when set against interest rates which are rapidly repricing higher.
KEY MARKET THEMES
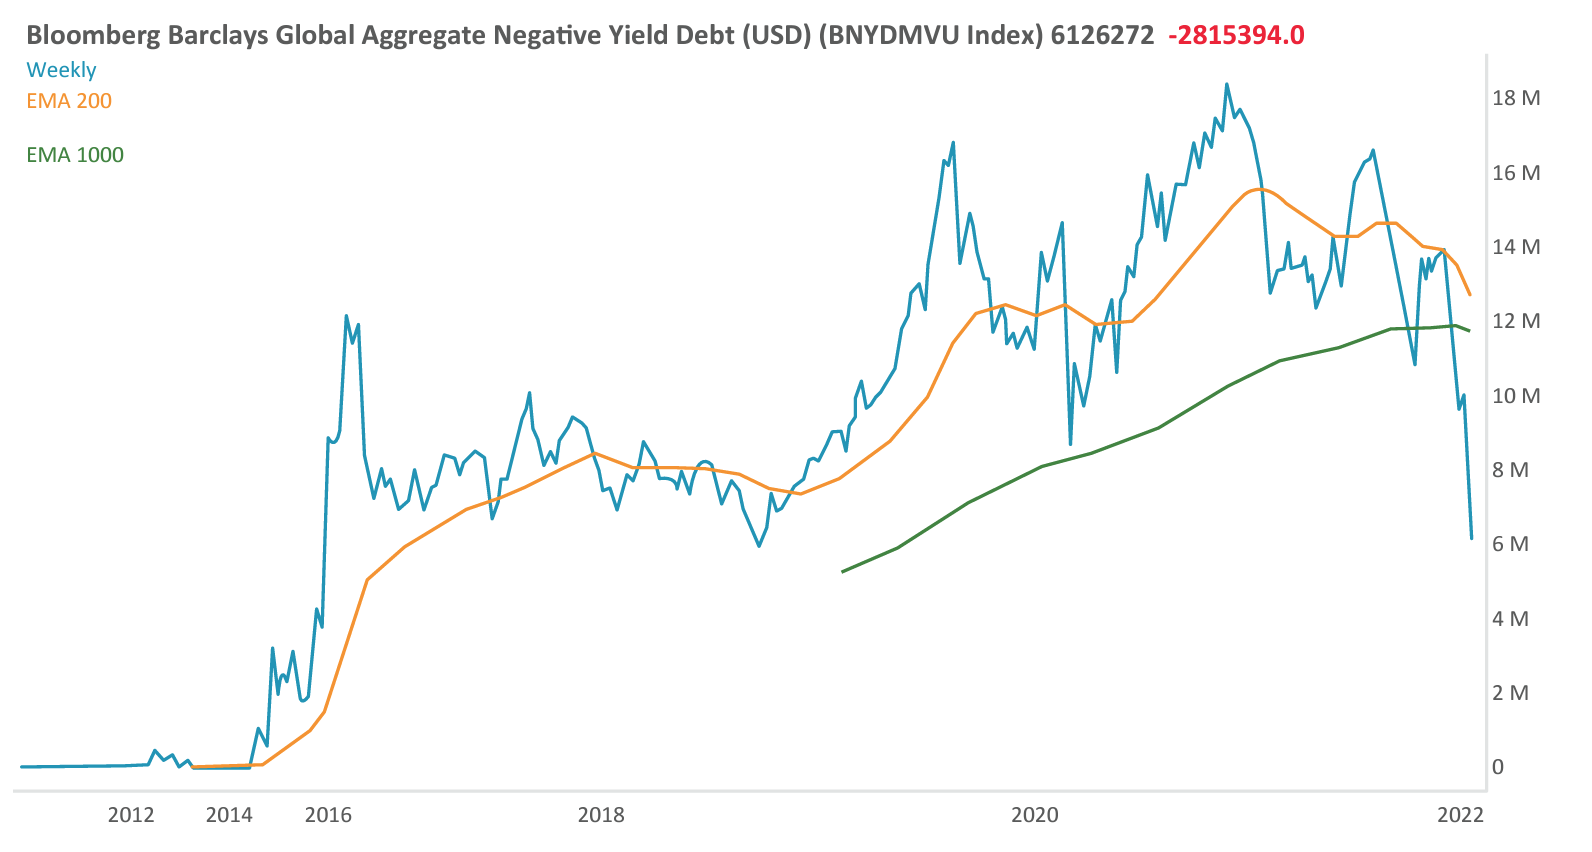
Whilst debt outstanding is typically not challenging for governments until it needs to be repaid, the pandemic precipitated unprecedented issuance of government bonds to finance fiscal support programs. Debt sustainability metrics haven't been the topic du jour for some time, but as interest rates rise, this will increasingly become part of the investing narrative. Recent weeks have seen a significant change in the macro environment, from December when yields had fallen aggressively. It was only a couple of months ago still possible to suggest that deflationary forces overwhelmed inflationary pressures. And it's still possible that many inflationary pressures that we're currently witnessing will ease as the months pass. However, at the moment, investors are not convinced and have begun to question the degree to which central banks are unable to control rising prices. As the chart below shows the total value of bonds and negative yields peaked at approximately 18 trillion December 2020. It is now nearer 6 trillion, with German bonds and European same sovereign yields breaking higher this week. That led to another 4 trillion of debt moving to a positive yield. Ultimately, that means anybody who has bought bonds in the last couple of years is now sitting on losses, which creates a significant issue for portfolio managers, particularly when many are compelled to invest 40% of portfolios into bonds, and the balance into equities
REMOVING THE PUNCHBOWL
It's likely that yields will continue to track higher whilst the Federal Reserve is minded to tighten interest rates. For any enduring rebound in bonds to take place, it will need to be accompanied by a significant announcement from central banks that they are likely to reengage with either quantitative easing or yield curve control. Just how sticky inflation pressures are, is going to have a big bearing on whether there is any rolling back of the Federal Reserve and the Bank of England for example, current stated positions. This is one of the reasons why stock markets have been so rocky in the last few weeks. Liquidity is being withdrawn from the system. Moreover, the US Treasury was rebuilding its cash reserve balance – in doing so, it took over 600 billion out of circulation which is significant form of quantitative tightening in its own right. That process is nearly complete and it will be one less pressure on stock prices in the coming weeks.
In fact, at this point, many shares which were previously darlings of the stock market, see the FANGMAN brethren, or SPACs or recent IPOs, are more likely to begin to unwind their short term oversold conditions from where we are. However, in the medium term, valuations are historically high and that means that assets are going to be more vulnerable to interest rate rights than they might normally be, were a correction to start with lower valuations. Now whilst money has been withdrawn from any stock markets, it's clear that commodities have been beneficiaries of a rotation in asset allocation on the part of institutional investors. Oil prices continue to trend higher and may even test the psychological $100 level. OPEC+ remains disciplined with supply increases and the major oil companies are reluctant or politically even unable, to increase spending on new production. Crude’s price has been raging for 14 years and this current rally is still 50% below its 2007 high. Spikes in energy prices are ultimately attacks on consumption - they will reduce consumer spending and destroy (consumer) demand at the margin.
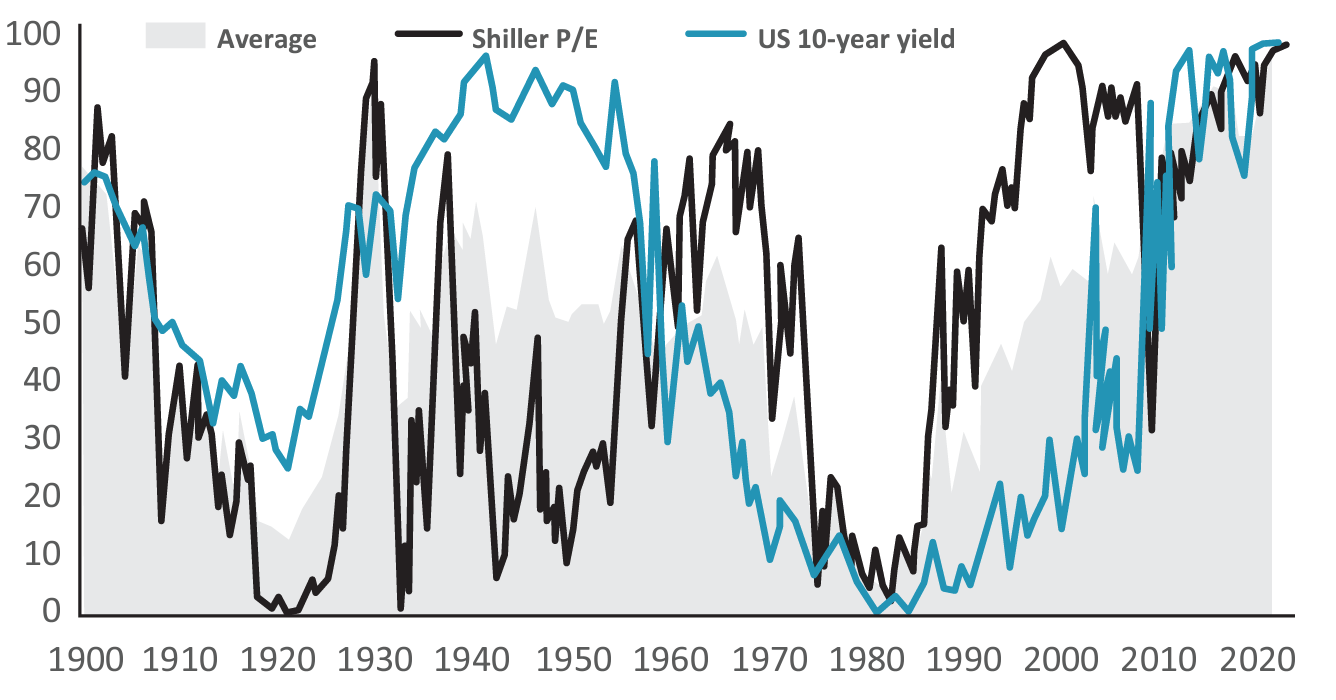
Expensive valutions after the bull market in every major asset class, similar to the Goldn 1920s and 1950s Valuation percentile (since 1871) (%)
Moreover, surging natural gas prices has seen Europe in particular experiencing an energy crisis. Ultimately, Europe's energy crisis is political in nature and require a political solution - all higher interest rates do is to support the currency which should mitigate the pressure on imported energy prices rather than dampening inflation – a practice in which Indian authorities are past masters.
CARBON RESILIENCE
Of course the huge structural meta trend which is the ESG movement has a significant role to play in current price trends. The ratio of US equities to oil peaked in 2020 when oil prices went negative and is now trending lower. The last time it peaked was in 1998, which was a lead indicator for the eventual demise of the tech boom at the turn of the century and the beginning of a massive commodity boom. As the world migrates towards spending on renewable infrastructure and hydrogen production capacity, there will still be chronic need for more fossil fuels and metals. As we are seeing in the prices of copper, industrial metals such as lithium, which have limited supply and of course, rising demand driven by the growing demand for electric vehicles.
ASSET CLASS VIEWS
Equities
• In general, many stocks markets, particularly those in the US have lost uptrend consistency. We believe the best-case scenario is this is a medium-term correction like late 2018.
• Back then, the confirmation of the Powell Put, following a 20% pullback, helped install a floor under prices.
• China's credit impulse is turning. That suggests there will be more money made available following the end of the New Year holiday to support the economy and particularly the property sector.
• Inflation has been much less of an issue in China than elsewhere because they ran tight money policies during the pandemic. That also implies they have more room to stimulate now that the economy is under stress and may be one of the stronger performing markets in 2022, along with commodity related indices.
Bonds
• Many investors spoke about the illogical trend of investment in negative yielding debt as the first upswing took place in 2016.
• However, as negative yields persisted, and became more negative, investors had little choice but to buy the bonds. Everyone who bought in the last couple of years is now sitting on losses.
• The Merrill Lynch 10yr+ Futures Total Return Index is testing the region of the 1000-day MA.
• This is only the second time in 42 years this has happened. The last time was in 2018 and the move was not sustained before ultimately central banks turned tail and began to ease once more.
Commodities
• Oil prices continue to trend higher and look likely to test the psychological $100 level. OPEC+ remains disciplined with supply increases and the major oil companies are reluctant/unable to increase spending on new production.
• Gold remains in a lengthy medium-term range. The price has repeatedly failed to sustain drops below $1800 and rallied above $1850.
• The LME Metals Index continues to march higher. Copper continues to have the clearest secular bull market fundamentals of any of the major industrial metals.
Currencies
• If copper, gold and oil continue to appreciate that would suggest a new secular inflationary trend and currencies such as the Australia Dollar, Canadian Dollar and Norwegian Krone should fare well.
• The Bloomberg Dollar Index pulled back sharply this week. A stronger US Dollar tends to coincide with stock market volatility, as a ‘safe haven’ move.
CONCLUSION
We believe we’re seeing the unwind of significant excess froth in certain sectors driven by the massive quantitative stimulus that the central banks applied in the wake of the pandemic. A coterie of shares, referred to as ‘Work From Home’ companies, be it Zoom, Twilio or Amazon, all benefitted from the liquidity pumped into stock markets, - which drove the US NASDAQ in March 2020 from 7000 to over 16,000 In less than 18 months. As interest rates went lower stocks that led these ‘growth stocks’ to ever higher valuations, (not necessarily earnings) and vastly outperformed other sectors of the market. However, as interest rates rise and liquidity is being withdrawn, we are seeing in real time the unwinding of this overshoot.
The Bloomberg Agriculture Subindex peaked in 1980 following a phenomenal bull market in the 1970s. Since then, there have been multi-year periods when prices rose aggressively but they were always followed by declines to new lows. However, coffee, soybeans, grains, sugar and all witnessing a major resurgence in performance in part due to the ‘nature is failing narrative’.
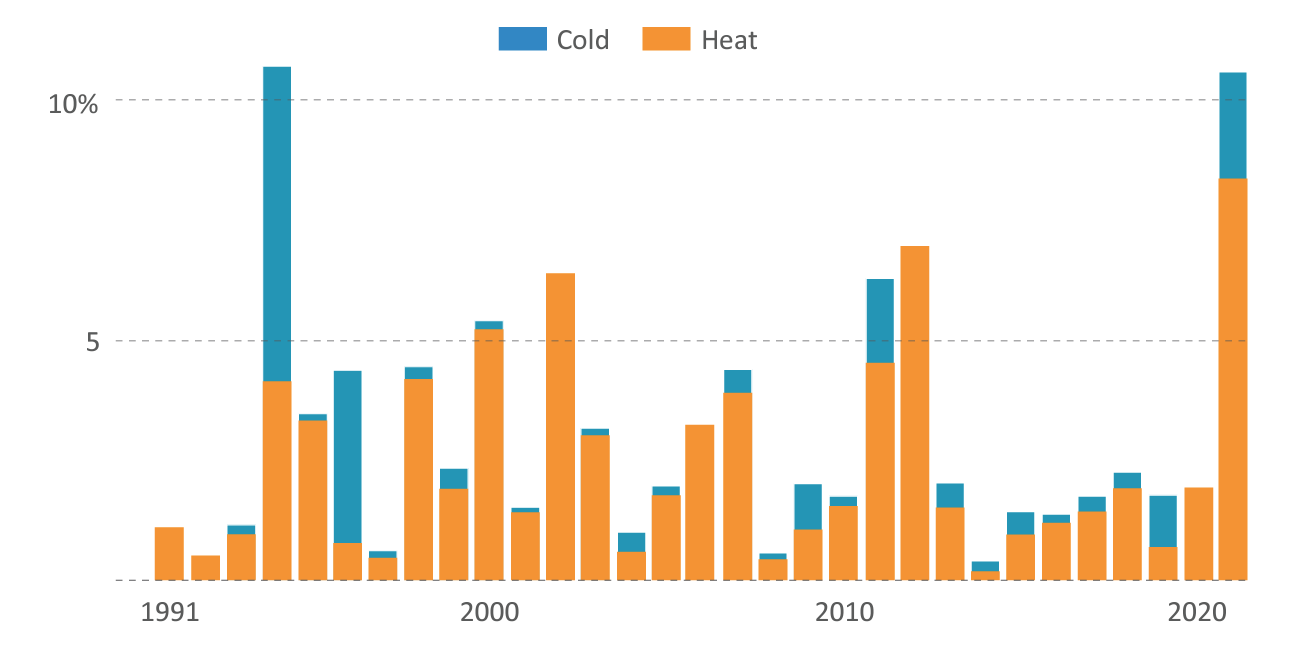
Frosts in Brazil, droughts in Latin America, floods in the US Midwest, massive rain events associated with hurricanes, record heat in Europe, the Middle East and Australia might be individually worrisome but combined point towards greater climate volatility.
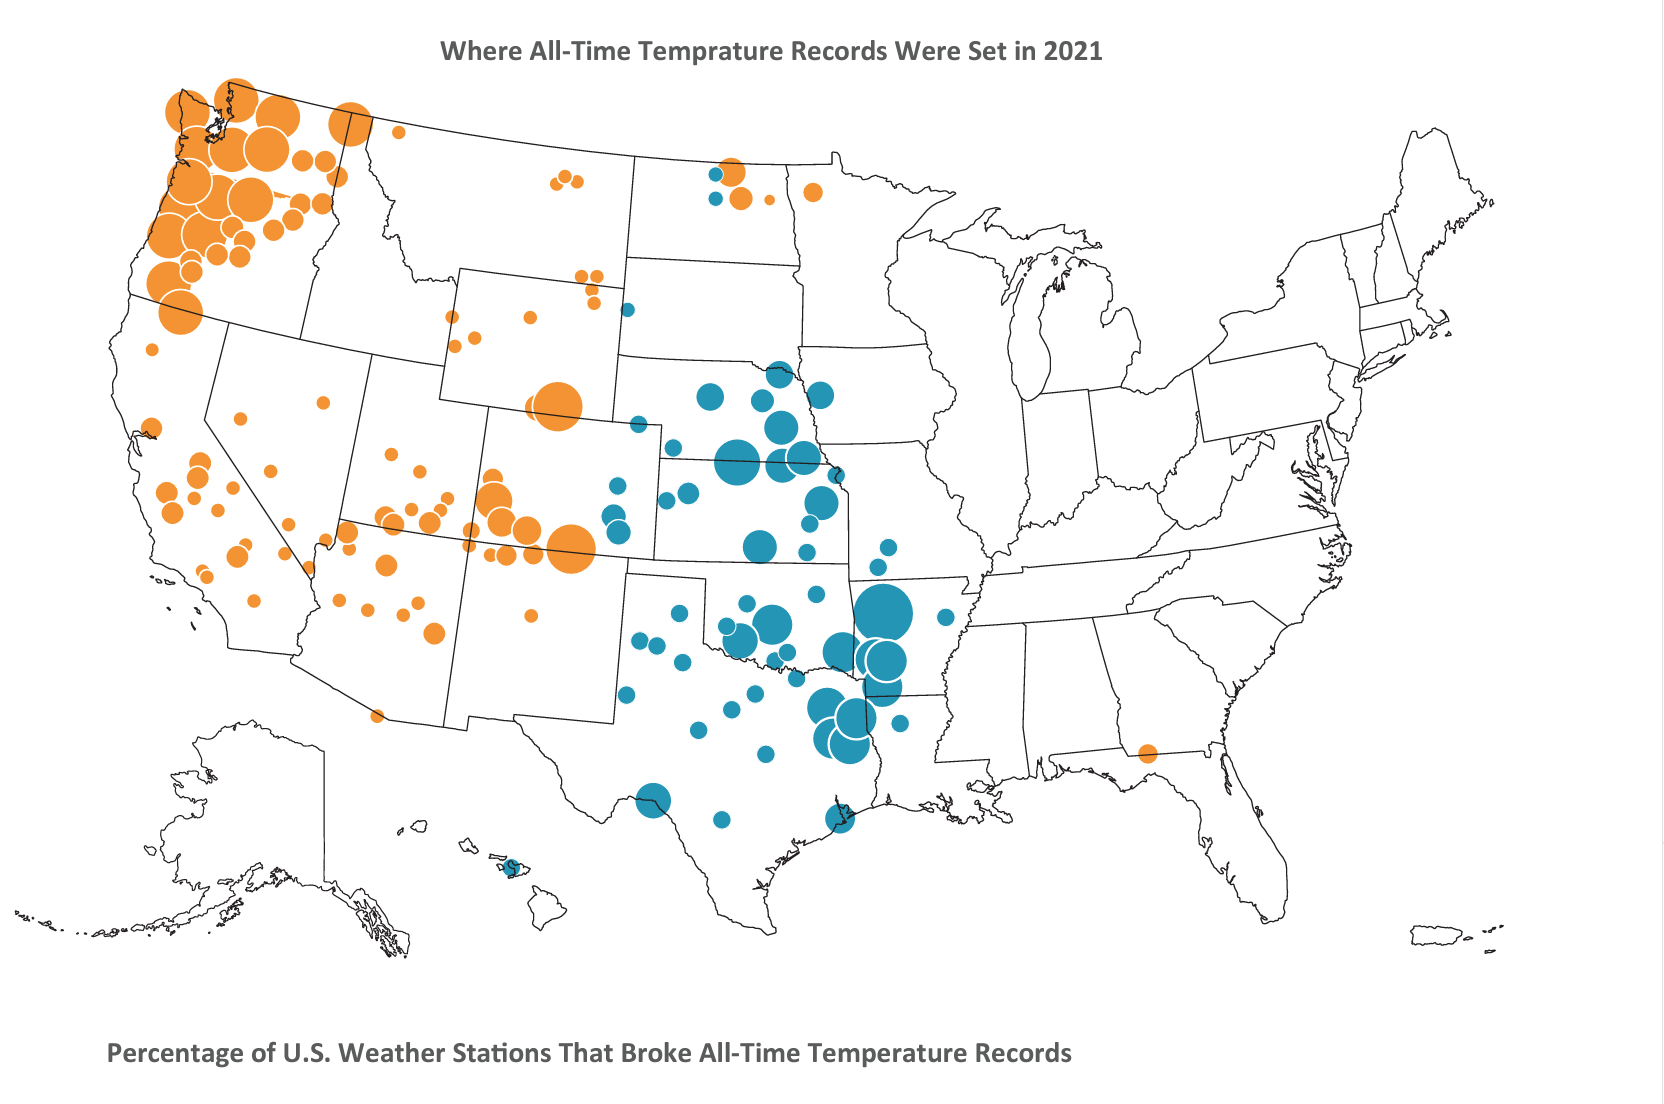
All time temperature records were set in 2021 at 10.6 percent of all U.S. stations
DISCLAIMER
This communication is from the ARIA SICAV, which is, as well as the above referenced sub-fund in Malta and regulated by the Malta
Financial Services Authority. Prospectus, annual report etc. are available free of charge from Fexserv Fund Services (Malta) Ltd. The Hub, Triq Sant ’Andrija, San Gwann, SGN 1612 Malta.
The information in this marketing communication does not constitute an offer, solicitation or recommendation for the purchase or sale of
any securities or other financial instruments nor does it constitute advice of any kind, whether in relation to legal, compliance, accounting,
regulatory matters or otherwise, a personal recommendation (as defined by the rules of the Financial Conduct Authority, or otherwise or an
expression of our view as to whether a particular financial product is suitable or appropriate for you and meets your financial or any other
objectives.
This document does not create any legally binding obligations on the part of ARIA and/or its affiliates. It is not intended for distribution or
use by any person or entity who is a citizen or resident of or located in any jurisdiction where such distribution, publication or use would be
prohibited. All recipients are (a) persons who have professional experience in matters relating to investments falling within Article 19(1)
of the Financial Services and Markets Act 2000 (Financial Promotion) Order 2005 (the “Order”) or (b) high net worth entities, and other
persons to whom it may otherwise lawfully be communicated, falling within Article 49 (1) of the Order (all such persons together being
referred to as “relevant persons”).
The Fund may neither be offered for sales nor sold in the USA, to US Persons or persons residing in the USA. The Fund mentioned herein
may not be appropriate for all investors and before entering into any transaction you should take steps to ensure that you fully understand
the transaction and have made an independent assessment of the appropriateness of the transaction in the light of your own objectives and
circumstances, including the possible risks and benefits of entering into such transaction. Please refer to the relevant fund’s full prospectus
and the relevant Key Investor Document for more information on the Fund which is available in English on request or on ariacm.com.
The information contained in this document is believed to be correct, complete and accurate and every effort has been made to represent
accurate information. However, no representation or warranty, expressed or implied, is made as to the accuracy, completeness or
correctness of the information contained in this document. ARIA assumes no responsibility or liability for any errors or omissions with
respect to this information. The information contained in this document is provided for information purposes only. In the case of any
inconsistency with the relevant prospectus of a product, the latest version of the prospectus shall prevail. This material contains results
that are simulated. Returns of the strategies/indices prior to their launch date represent simulated results based on historical data and
retroactive application of a model designed with the benefit of hindsight. Simulations are based on a number of working assumptions
that may not be capable of duplication in actual trading. Simulated performance results have certain inherent limitations. Unlike an actual
performance record, simulated returns do not represent actual trading. Also, since the trades have not actually been executed, the results
may have over or undercompensated for the impact, if any, of certain market factors such as liquidity constraints, fee schedules and
transaction costs. No representation is being made that future performance will or is likely to achieve profits or losses similar to those
shown.

GET IN TOUCH
For more information and answers to any questions you may have, please contact us.